Retail analytics dashboard
live demo// From a Power BI report to a phone-first web dashboard, fed by a nightly pipeline
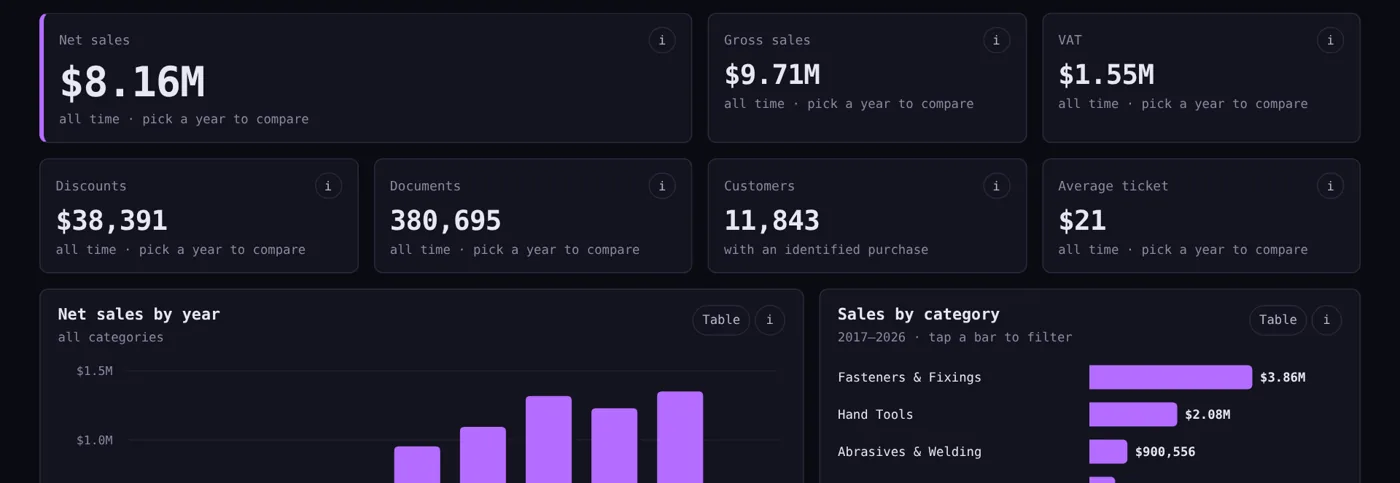
Built for a small retail client, rebuilt here with synthetic data and a fictional store. Sales, products, customers, inventory and forecast on one page that loads fast on a phone.
- Read the client's Power BI model (5 pages, ~40 visuals, 60+ DAX measures) and rebuilt every number in Python to reconcile it.
- Found that the original report overstated net sales by over a third: it counted quotes and added credit notes instead of subtracting them.
- Nightly Airflow job pulls from the retail ERP API, writes parquet, and rebuilds a small aggregated data cube; a failed build never replaces the last good one.
- ABC segmentation, a 4-week demand forecast valued in dollars, and stock-reorder rules (7 days of demand plus safety stock).
- Hand-built SVG charts with no chart library, light and dark themes, and an (i) explanation on every chart.
- Python
- pandas
- DuckDB
- Airflow
- parquet
- vanilla JS + SVG